
Start with the moment that goes wrong. Does the server feel slow around a loaded animal area, when someone requests new terrain, or during one large edit? Each points to a different recording. A server profile explains tick work; it does not measure the frames your own computer draws.
| What you can reproduce | First question to investigate |
|---|---|
| Delay around the same loaded animal area | Which entity work is present, and does one controlled population change alter tick duration? |
| Delay when requesting new terrain | When does the route finish, and which threads do the work? |
| One brief editing stall | Which event lines up with the delay, and does spreading the same edit change its longest tick and finish time? |
Animal work: a change that survives the return trip
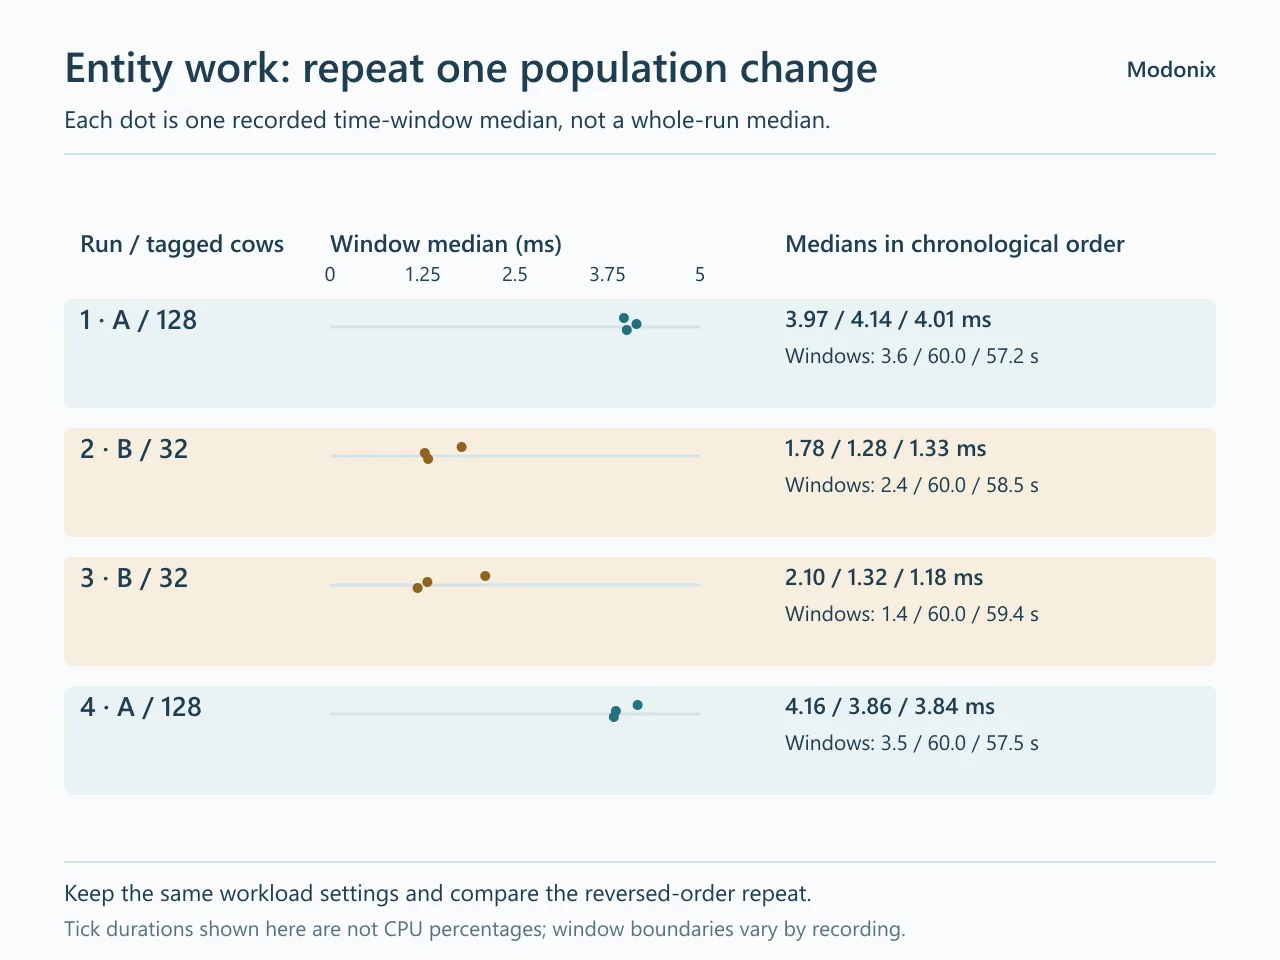
Our controlled example used 128 cows, then 32, repeated 32, and finally returned to 128. The selected approximately one-minute windows had lower median tick durations in both smaller-population runs. TPS stayed near 20 throughout, so reading TPS alone would have missed that difference.
| Recording order | Cows in the comparison group | Median tick duration in the selected ~60-second window |
|---|---|---|
| A1 | 128 | 4.142 ms |
| B2 | 32 | 1.281 ms |
| B3 | 32 | 1.316 ms |
| A4 | 128 | 3.863 ms |
Each recording lasted about 121 seconds. The medians above belong to individual windows of about 60 seconds; they are not medians calculated across the entire recording. This was a synthetic server comparison with no joined players. It gives us a concrete example of entity work, rather than a promise about every farm or multiplayer session.
To follow the same branch in the viewer:
- On the viewer’s homepage, use Choose File or drag a local profile onto the file box. Review its contents first: profiles can include server configuration and JVM arguments. This example uses a privacy-redacted copy with the measurements unchanged.
- Select Yarn (1.21.1) in the mappings selector for this recording. Some methods become readable while others remain
method_N; match mappings to your own recorded version. - Choose all / All View, expand Server thread, and keep opening the server call rows until you reach ServerWorld.tick. The intervening MinecraftServer rows may still have unmapped names.
- Expand EntityList.forEach, then the intervening entity callbacks and tickEntity rows to reach MobEntity.tick. Open it to see LivingEntity.tick and the animal movement work below.
In this first recording, the expanded viewer showed MobEntity.tick at 9.15%. That is this node’s inclusive share of the selected thread’s sampled time, including work below it. It is not 9.15% CPU usage, and adding the parent and child percentages would count overlapping work again.
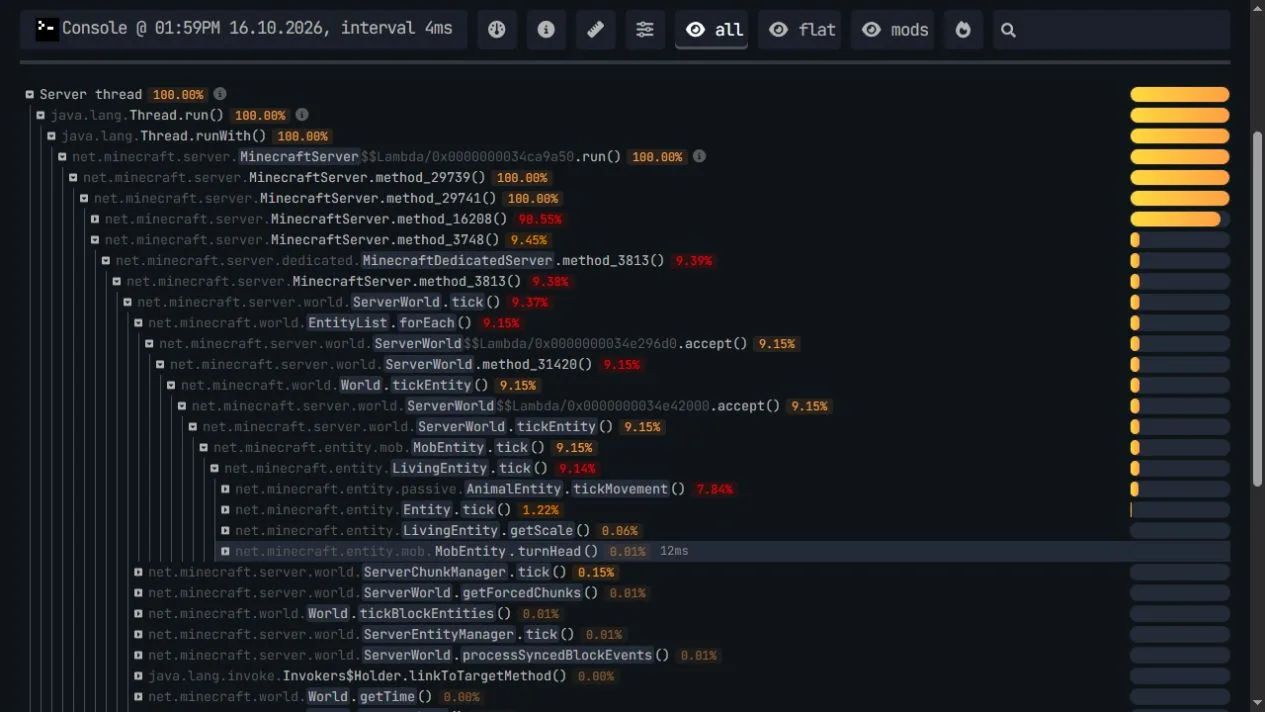
Use that branch to choose the next experiment. On a world copy or a reversible test area, change one relevant part of the animal workload, keep the area loaded in the same way, and repeat the action. Compare tick duration as well as the branch. A smaller bar can reflect a changed denominator, including waiting; it is not a speedup measurement by itself.
New terrain: watch when the journey actually finishes
If the delay follows requests for new terrain, compare the same route with an already generated and saved copy. Keep a record of when the requested route finishes. A chunk becoming loaded is not, by itself, proof that the game generated it from scratch.
Our terrain example requested the same 32 chunk targets in an 8-by-4 route, first where they had not been generated, then in a normally generated and saved copy. We repeated the saved route and returned to an initially absent route. All four runs completed all 32 requests; there were no joined players.
| Recording order | Route at the start | All 32 targets completed after | Remaining recorded time after completion |
|---|---|---|---|
| A1 | Not yet generated | 65.109 s | 55.344 s |
| B2 | Already generated and saved | 16.750 s | 103.531 s |
| B3 | Already generated and saved | 16.938 s | 103.687 s |
| A4 | Not yet generated | 78.657 s | 42.312 s |
Both saved-route runs finished sooner than both initially absent-route runs, including the return comparison. That supports a useful troubleshooting step: compare new travel with a saved route before treating every travel delay as the same problem. It does not isolate terrain generation from loading, disk and operating-system caches, or worker scheduling.
Each recording continued for about two minutes. The saved routes finished earlier, leaving more of that recording after the work was done. Keep this idle time in mind when comparing the profiles.
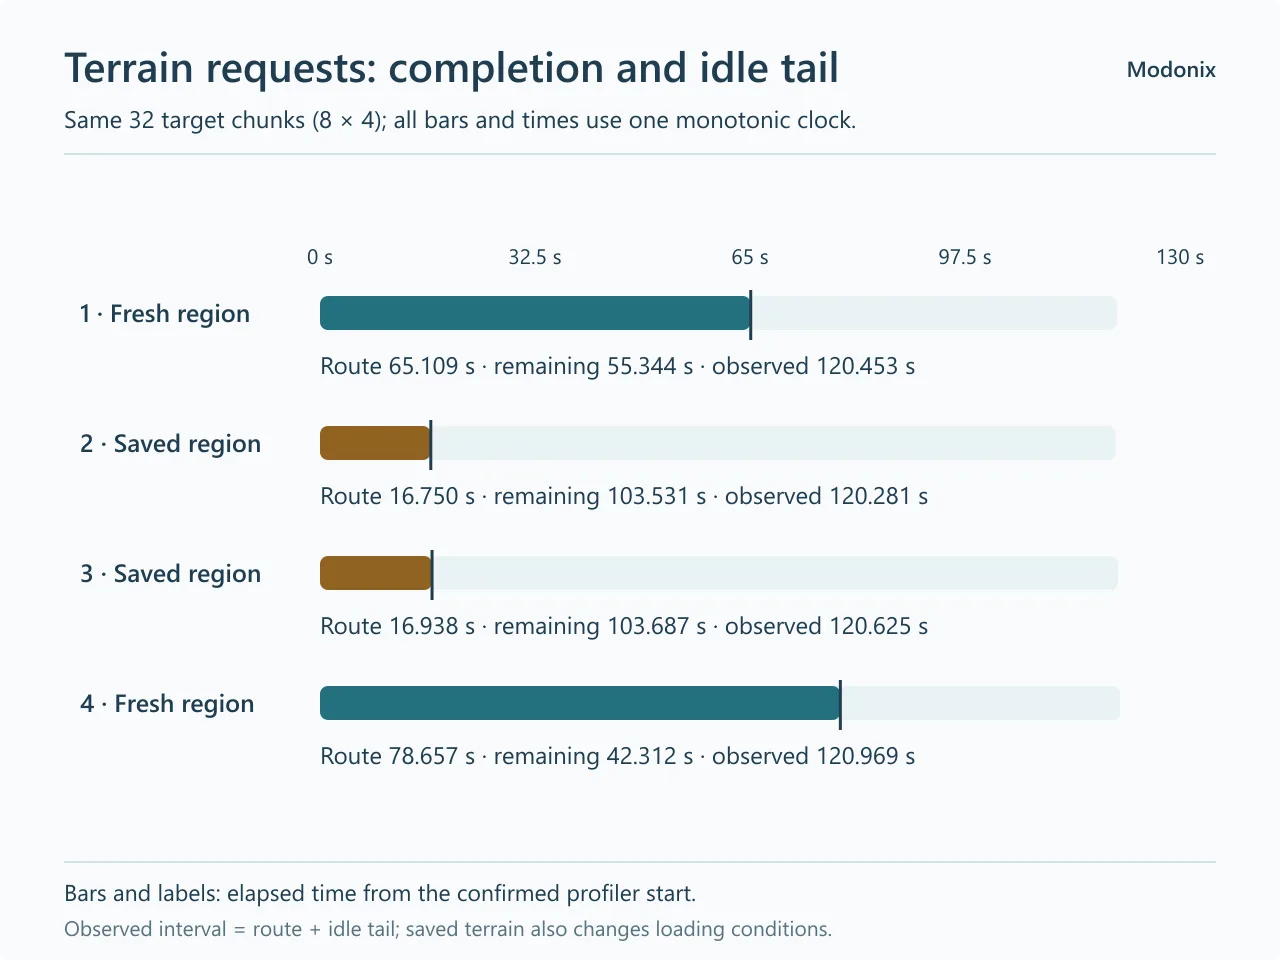
Compare the same part of each route, rather than the entire two-minute recordings: the saved routes leave much longer idle tails. A smaller full-profile bar can simply mean that more waiting was included. Follow relevant worker threads as well as Server thread; the main thread can be waiting for work elsewhere. In these recordings, Worker-Main and IO-Worker groups also appear. Their totals can combine several threads, so they are neither CPU utilization nor elapsed route time.
For your own comparison, choose a bounded route in a world copy, record its completion, save it normally, then repeat the same route with the same request pace. Keep the finish time as well as the profile. Repeat in the reverse order where possible; one quicker return trip does not establish a general optimization.
Short stalls: keep the edit and the waiting apart
A brief stall needs an event time, not just an average. The comparison here uses the same bounded administrative block edit performed in one large step or spread across ticks. The two questions are whether the longest working tick changes and whether the edit takes longer to finish.
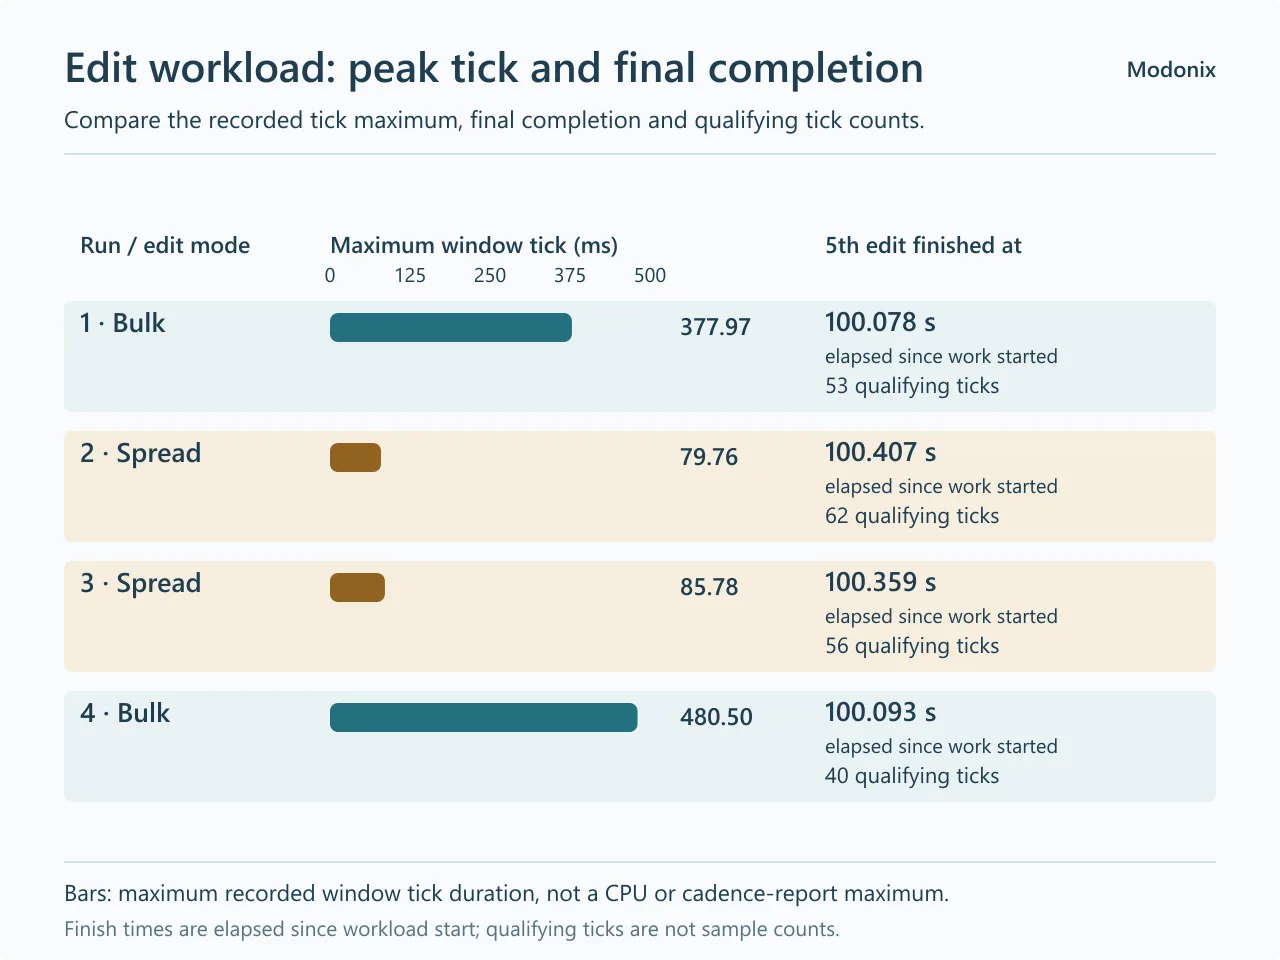
Each trial completed five edits. The bulk version used one 32,768-block fill per edit; the spread version used eight 4,096-block slices, one per tick. Both performed the same 163,840 block operations.
| Recording order | Edit form | Maximum recorded tick | Included ticks in the 50 ms filtered profile |
|---|---|---|---|
| A1 | Whole fill | 377.968 ms | 53 |
| B2 | Eight slices | 79.762 ms | 62 |
| B3 | Eight slices | 85.779 ms | 56 |
| A4 | Whole fill | 480.498 ms | 40 |
Both spread trials had a lower recorded maximum than both bulk trials, including the reversed-order repeat. Yet they had more qualifying ticks, not fewer. Spreading changed the shape of this workload; it did not make every measure improve.
The maximum values come from the profile’s recorded platform-statistic windows across approximately 120-second recordings. Keep them separate from tick-monitor callback intervals and from an individual fill’s execution time.
The edits were scheduled 20 seconds apart, with the fifth slot at 100 seconds. In both spread trials the fifth edit finished later—about 0.3 seconds later in the paired comparisons. Finishing near the 100-second mark does not mean that one edit took 100 seconds, and this schedule does not provide an end-to-end speedup measurement.
Use tick-monitor messages to find candidate moments, then check them against the profile and the edit’s completion. The observed tick cadence can include scheduled waiting. A message around 50 milliseconds is not proof of a 50-millisecond CPU stall, and a large park or sleep branch is not work you should automatically remove.
Keep a filtered recording’s scope beside it: it shows qualifying ticks, not the server’s average activity. If no ticks qualify, retain that result and the task’s timing rather than drawing a replacement call tree or calling the operation free.
Keep the displayed window and labels straight
A hosted viewer can load analytics and other resources while reading a file locally. Keep an untouched original and review the copy you choose to open or share; a local-file view is different from creating a public report link.
Use All View to follow calls. Flat View has controls labelled Total Time, Self Time, Top Down, and Bottom Up. Use the labels to keep track of which quantity and direction you are reading, and keep the selected time range fixed. A source or mod grouping helps choose where to look; confirm the next change by recording it again.
Collect a comparison you can use
- Choose one repeatable action. Note where the delay happens, what you do, and how you will tell when the action finishes. Check whether another administrator is already profiling before starting another recording.
- Record that action for a matching window. Use the commands below and keep duration and sampler settings consistent. Save the original profile and its timing note.
- Follow one relevant branch, then change one thing. Use the animal, terrain, or short-edit question above. Make the change on a copy or in a reversible test area.
- Repeat in the other order. Compare absolute tick durations and task completion, not just bar sizes. Keep an adverse or inconclusive repeat in the result.
Useful commands for these steps:
/spark tpsreads recent TPS and tick-duration statistics. Keep their displayed rolling windows beside the numbers./spark profiler startstarts an ordinary recording;/spark profiler infochecks its state./spark profiler stop --save-to-filesaves the profile locally. Review it before choosing how to open or share it./spark profiler start --thread *records all threads for a separate investigation where worker activity matters./spark tickmonitor --threshold-tick 50helps locate candidate long tick intervals./spark profiler start --only-ticks-over 50creates a separately filtered recording; neither command turns elapsed time into CPU usage.
In a server console, omit the leading slash. /spark profiler cancel discards a recording; running /spark tickmonitor without flags toggles monitoring, so check its state first. Use the commands supported by your selected installation; the download-selection guide helps keep client and server files apart.
Keep a short note with each comparison: the symptom, the action, the chosen window, the branch, the one change, when the task finished, and what happened on the repeat. That gives you something concrete to keep or undo.
Comments 0
Share what worked, ask for help or reply to another player.
Use your Modonix account to join the discussion and manage your comments.
Sign in to commentNo comments yet. Share what worked for you.